Listed below are the categories of work under economics, specifically microeconomics, which ponder the Production Possibility Curve. Now, imagine being deserted on an isolated island, where you would either be gathering the coconuts or fishing. There is a cruel interplay with scarcity! And scarcity necessitates choice. This is where the Production Possibility Curve comes in handy.
Economies of Production Possibility Curve are Graphs. The graph represents an economy with limited resources whereby the maximum production of any two goods in question is possible; It is very useful in depicting trade-offs and efficiency in economics. Accordingly, let us advance in our understanding of its application.
Understanding the Nuts and Bolts of the Production Possibility Curve
Now, let’s discuss the ins and outs of the PPC.
The Production Possibility Curve (PPC) gives a theoretical consideration showing the maximum quantity of two goods that can be produced when resources are fully and efficiently utilized. It is also sometimes called the Production Possibilities Frontier (PPF). It shows what can and can’t be done with the existing resources.
Assumptions Underlying the PPC Model
These assumptions give the PPC model a few key rules:
- First, the quantity of resources remains fixed
- Second, technology remains unchanged
- Thirdly, all resources are employed to the fullest
This gives the PPC model simplicity. In real-world conditions, however, it is very complicated.
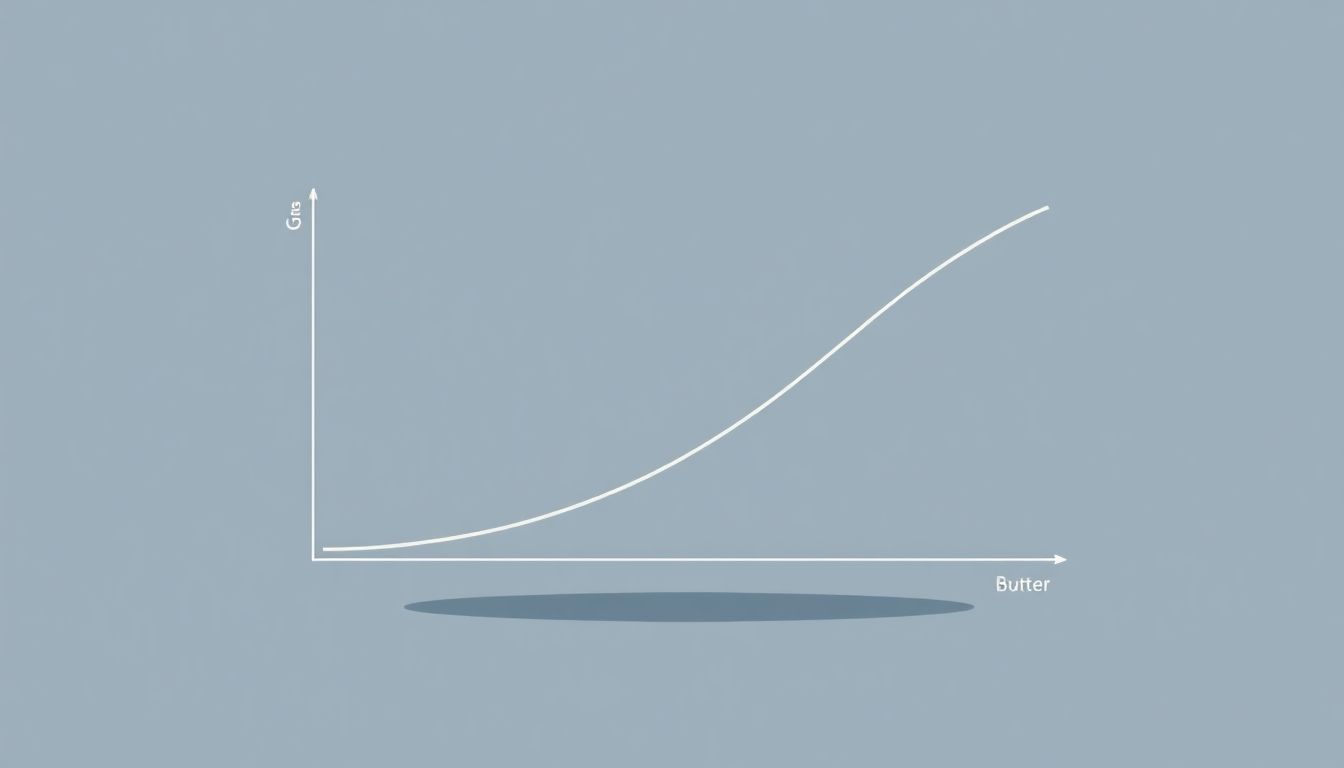
Components of the PPC: Axes, Curve, and Points
In the PPC graph, there are two axes. Each axis refers to a good or service (like fish or coconuts). The curve itself describes maximum quantities of production. Points on the curve are efficient points of production; points inside the curve depict inefficient production; and points outside the curve are unattainable under the currently available resources.
The Shape of the Production Possibility Curve and Opportunity Cost
The shape of the PPC says much about opportunity cost.
Concave Shape and Increasing Opportunity Cost
On the whole, PPCs are concave. This outward-bowed shape indicates increasing opportunity costs. The more of one thing that is produced, the more of the other has to be given up. Think of it this way: the initial coconuts would be easy to gather, whereas further time would have to be expended for more production.
Constant Opportunity Cost and Linear PPCs
In some cases, the PPC is a straight line, meaning the opportunity cost is constant. In an example where the cost of each additional widget is an additional gadget, the PPC will thus be straight. This is the rarer occurrence, but it does happen.
Finding Opportunity Cost from the PPC
Opportunity cost is what you forego in order to attain something else. It can be calculated with the use of the PPC. Imagine shifting from one point on the curve to another; the amount of the other good lost during this movement is opportunity cost. This involves some calculation.
Factors Affecting the Shift in Production-Possibility Curve
Theoretical Production-Possibility Curve is not fixed in one place. It could move.
The Technology Development and Innovation
When a new technology comes about, it would lead to increased production abilities. That would shift the PPC outwards, indicating that with the same resources, more of both goods can be produced, which is worthwhile.
Alterations in Resource Availability
The more resources, the more the production possible. Discover an extra spot for fishing, or more coconut trees? PPC shifts out. Less resource? The curve shifts inward.
Education and Human Capital
Education in the worker enhances skills. Better skills mean more productive workers. The PPC then shifts outward. Better investment into humans occurs!
Uses of the Production Possibility Curve in Economics
Many uses exist for the PPC.
Economic Growth and Development
Economic growth implies that the PPC is pushed outward. Thus, it indicates an improving capacity to produce goods and services in the particular country. The PPC is a measure of this.
Trade and Its Specialization
Trade is one benefit that PPC shows. Countries may specialize in things they do best. After specialization, they trade and consume beyond their own PPC.
Resource Allocation Decisions
The PPC will provide the government with a good view of where to allocate resources. Should they invest in education or healthcare? The PPC does provide a view of the trade-offs.
Limitations of the Production Possibility Curve Model
The PPC is an imperfect tool.
Assumptions that Simplify Reality
The PPC has its assumptions: full employment? Fixed resources? The reality is much more chaotic. Transgressions like this hinder its accuracy.
Static Nature of the Model
The PPC shows a snapshot; it shows nothing about change through time. We live in a dynamic world: this is a static model of that world.
Difficulty in Measuring Real World Production Possibilities
Measuring actual production possibilities for an entire economy is really tough. Getting the data is tough. This makes application of the PPC difficult in practice.
Conclusion
The Production Possibility Curve is a handy tool. It tells us about trade-offs, efficiency, and economic growth. But the PPC has limitations. Regardless, it is a very good start to consider any economic choices. Now, make your bold move and make a wise choice.